Key Points
Key Points
- Alaska's glaciers melt three extra weeks for every 1 degree Celsius of summer warming, tracked by Sentinel-1 radar.
- SAR radar sees through clouds and darkness, so melt seasons are watched year-round, not once a season.
- Greenland and Antarctica lost 11,309 billion metric tons of ice between 1979 and 2023, raising sea level 31.4 millimetres.
- About 84 percent of ice sheet loss came from glaciers flowing faster into the ocean, not surface melting.
- Shrinking glaciers sink to lower, warmer altitudes, adding extra loss in a feedback loop.
- A 2026 global ice-cliff survey found rapid retreats so far were short-lived, with glaciers restabilizing.
- Every centimetre of sea level rise puts another 2 to 3 million people in the path of annual flooding.
On This Page
- What You Will Learn in This Article
- Three Extra Weeks of Melt for Every Degree
- Subscribe to CAAW News
- Twelve Trillion Tons Gone Since the 1970s
- Why a Glacier’s Shape Speeds Its Own Decline
- What the Ice Cliffs Tell Us About the Future
- Why This Matters for Coastal Towns
- Frequently Asked Questions
- How do scientists track glaciers without visiting every one?
- How much have Greenland and Antarctica lost?
- Is surface melting or glacier flow the bigger cause?
- What is a melt day?
- Does glacier shape really change the melt rate?
- Will ice cliffs collapse and flood the world suddenly?
- Why should I care about a few centimetres of sea level rise?
- Final Thoughts
- React to this story
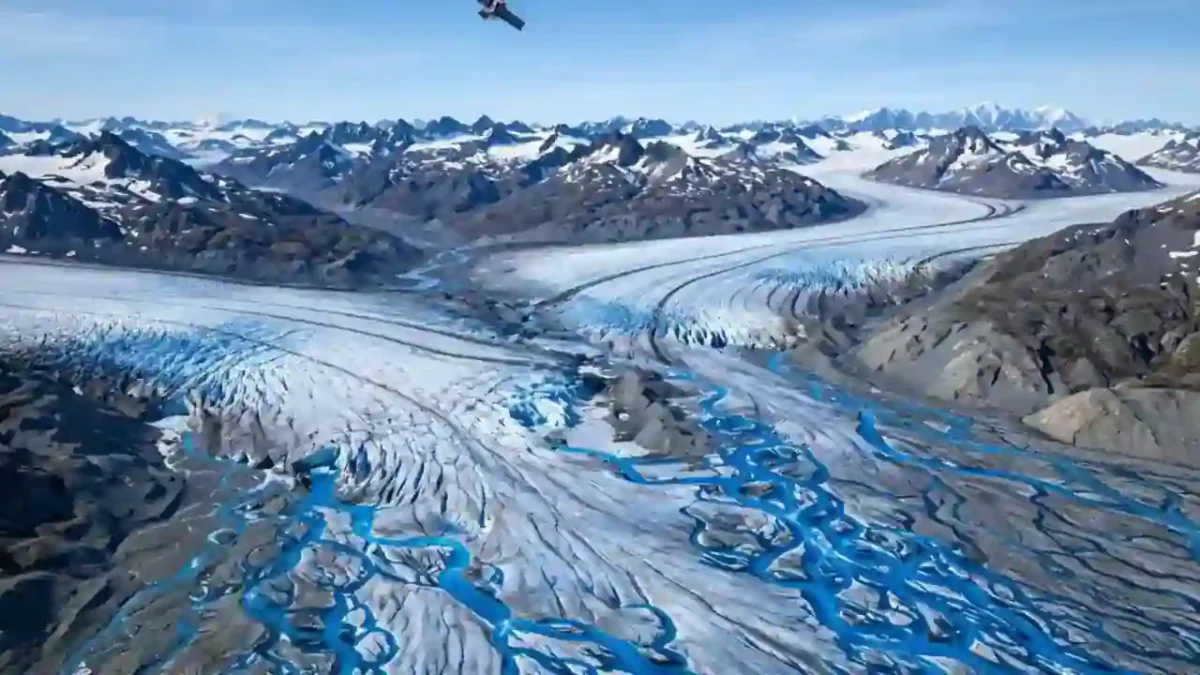
I first understood glacier loss not from a chart, but from two photographs of the same Alaskan valley, taken thirty years apart. In the first, a river of ice filled the valley floor. In the second, the ice had pulled back like a tide going out, leaving grey rock and a milky lake. I stared at those two pictures for a long time, because they made an abstract number feel real. Since then, I have followed how scientists actually measure this retreat, and the tools they use today would have seemed like science fiction a generation ago. In this article, I will show you how scientists are tracking melting glaciers in 2026, from radar satellites that see through clouds to field teams drilling on the ice. If you have ever wondered how we know the ice is melting, how fast, and what it means for sea level, this one is for you. By the end, you will be able to read a glacier headline and know exactly what sits behind it.
Trust nudge: I am not a glaciologist. The findings below come from peer-reviewed studies and science reporting I checked during my research, and I name the study, the satellite, and the numbers each time, so you can check them yourself.
What You Will Learn in This Article
- How radar satellites track melting through clouds and polar darkness
- Why Alaska’s glaciers melt three extra weeks for every degree of summer warming
- How much ice Greenland and Antarctica have actually lost since the 1970s
- Why glaciers speeding up matters more than surface melting
- How a glacier’s own shape accelerates its decline
- What new ice-cliff surveys tell us about future sea level rise
- Answers to the questions readers ask most about glacier tracking
Three Extra Weeks of Melt for Every Degree
I love this study because it turns a vague worry into a number you can hold. Scientists at Carnegie Mellon University and the University of Alaska Fairbanks used satellite radar to track nearly all Alaska glaciers larger than about half a square mile, from mid-2016 through 2024. Their finding is strikingly simple: Alaska’s glaciers melt for three additional weeks with every 1 degree Celsius increase in average summer temperature, according to satellite-mounted radar data. One degree of warming, three more weeks of melting, year after year. When I first read that, I did the mental maths for two degrees, and I stopped enjoying the exercise.
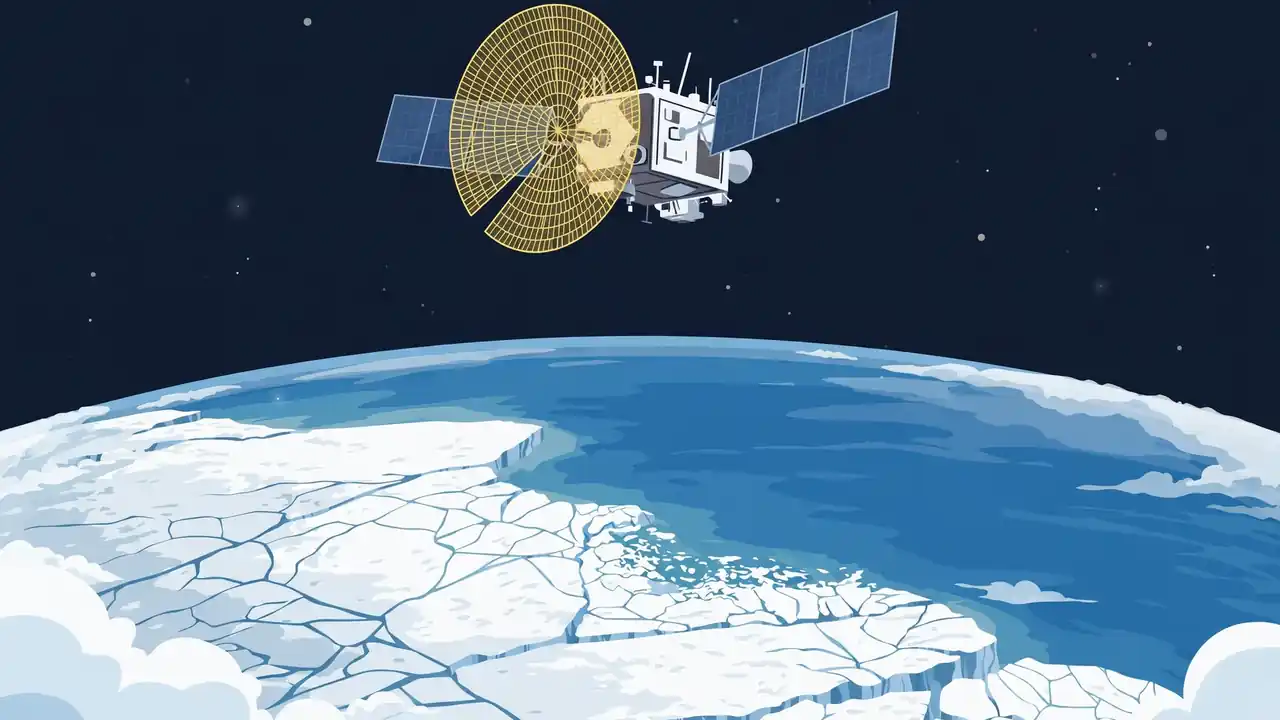
The tool behind the number is synthetic aperture radar, or SAR, carried by Europe’s Sentinel-1 satellites. SAR sends microwave pulses at the ground and builds images from the echoes, which means it works through clouds and in darkness, unlike cameras. The researchers showed that SAR can consistently and automatically monitor glaciers and their snowlines year-round, where older optical methods usually only measured at the end of the melt season. They counted “melt days,” meaning days when a glacier’s surface is melting, and watched the melt season stretch longer as summers warmed. The findings were published on February 4 in the journal npj Climate and Atmospheric Science, led by recent PhD graduate Albin Wells. For me, the real breakthrough is not just the number. It is that we can now watch the melt season unfold week by week, for almost every glacier in Alaska, without waiting for a clear day or a field season.
Twelve Trillion Tons Gone Since the 1970s
If the Alaska study is a close-up, the next study is the wide shot, and it is enormous. An international team called IMBIE combined 42 independent satellite surveys from 27 satellite missions, reaching back to 1972 for Greenland and 1979 for Antarctica. Their result, published in September 2026 in the journal Scientific Data, is that Greenland and Antarctica have lost 11,309 billion metric tons of ice between 1979 and 2023, pushing global sea level up by 31.4 millimetres. That is about 12.5 trillion tons in the imperial counting used by some reports, enough frozen water to stack ice five feet deep across the continental United States, according to the same reporting. Greenland lost the larger share, and Antarctica contributed 13.3 millimetres of the rise.
Here is the detail that surprised me most. Most of that loss did not come from ice melting on the surface. About 84 percent of the combined loss was driven by glaciers speeding up and pouring more ice into the ocean, with just 16 percent due to surface melting. Warmer ocean water eats at glaciers from below and from the sides, loosening them so they flow faster into the sea. Study co-author Eric Rignot of the University of California, Irvine, put it bluntly in the reporting: the ice sheets are melting away fast, sea level is rising worldwide, and coastal regions will feel it. The ice sheets are now responsible for around a quarter of all global sea level rise. When I explain this to friends, I use a simple image: the ice sheets are not just melting like an ice cube in a glass. They are sliding into the ocean faster, like a conveyor belt speeding up.
Why a Glacier’s Shape Speeds Its Own Decline
I used to think a glacier melts at whatever rate the air temperature dictates, like butter in a warm room. A 2026 study from the Spitsbergen archipelago in the Arctic taught me otherwise. Researchers compared satellite terrain models against a 2008 baseline and found that as glaciers shrink, they sink to lower, warmer altitudes, which makes them melt faster still. The Aldegonda glacier experiences 1 to 2 percent additional annual ice loss, while the West Grenfjord glacier loses 0.5 to 1 percent more, due to altitude shifts. It is a feedback loop: warming shrinks the glacier, the smaller glacier sits lower, lower air is warmer, and the warmer air shrinks it further.
This matters for tracking, because it means scientists cannot just measure temperature and predict melt. They must also measure the glacier’s shape, elevation, and flow, year after year, and feed all of it into their models. That is why modern tracking mixes so many tools: radar for melt days, laser altimeters for height changes, gravity satellites for mass changes, and optical images for the glacier’s outline. No single instrument tells the whole story. I find that reassuring, actually. When several independent tools point the same way, the conclusion is much harder to dismiss. And when they disagree, scientists say so, and that disagreement is where the next study begins.
What the Ice Cliffs Tell Us About the Future
One of the scariest ideas in sea level science is marine ice-cliff instability: the fear that tall ice cliffs at the ocean’s edge could collapse in a runaway chain, driving rapid sea level rise. Until recently, that idea rested mostly on models and a handful of individual glaciers. In October 2026, a global survey published in the journal Science changed that. Researchers examined thousands of ice cliffs across Earth’s ice sheets using one consistent set of satellite observations, giving scientists a real-world dataset to test the theory against. The survey’s reassuring finding is that the rapid retreat documented so far is short-lived and the glaciers eventually restabilize, according to geophysicist Jeremy Bassis of the University of Michigan, an author of the study.
I want to be careful with that reassurance, because the scientists are careful too. Restabilization so far does not guarantee restabilization forever, especially as warming pushes ice sheets further from their comfort zone. The value of the survey is not a clean verdict. It is a better test. Models that predicted runaway collapse must now match thousands of real cliffs, not a few chosen examples, and the cliffs that behave differently will teach us why. That is how tracking turns into understanding: not by one dramatic number, but by thousands of careful measurements that slowly narrow what is possible. If you want to follow the wider climate story behind these numbers, our COP30 climate summit report and our ocean cleanup story show the same pattern: slow measurement, then decisions.
Why This Matters for Coastal Towns
Numbers like 31.4 millimetres can sound small, and I have heard people dismiss them for that reason. Here is the number that stopped me from dismissing them. For every centimetre of sea level rise, another 2 to 3 million people are flooded at least once a year, according to lead study author Ines Otosaka of Northumbria University. Three centimetres already means millions more people facing annual floods, and the melt is accelerating, not slowing. That is why tracking matters beyond science. It tells coastal cities how high to build, insurers what to charge, and families whether their street will flood in their lifetime.
Tracking also gives us something rarer: an early warning we can actually use. When radar shows a melt season stretching three weeks longer, or when a glacier’s flow speeds up, scientists can flag it years before the sea level consequences arrive. I think of glacier tracking like a heart monitor for the planet. Nobody watches a heart monitor because it is exciting. They watch it because it tells them when to act. The satellites, the field teams, and the models together are that monitor, and in 2026 they are sharper than ever. If you enjoy this kind of science, you may also like our Europa Clipper story about hunting beneath alien ice, our story on how scientists use AI to discover drugs, our CRISPR gene-editing explainer, and our fusion energy story. Different fields, same method: measure carefully, then decide.
Frequently Asked Questions
How do scientists track glaciers without visiting every one?
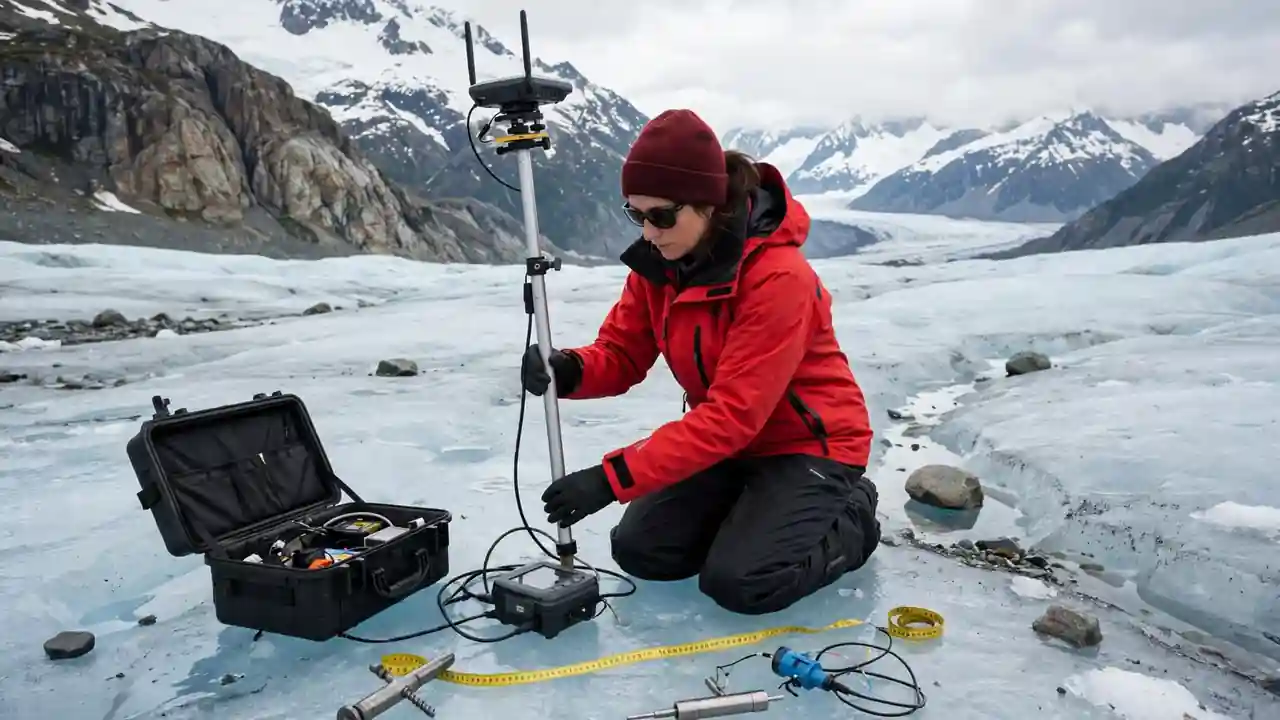
They use satellites. Radar satellites like Sentinel-1 see through clouds and darkness to count melt days. Laser altimeters measure height changes. Gravity satellites weigh mass changes. Field teams then check the satellite results on a few glaciers in person, so the whole system stays honest.
How much have Greenland and Antarctica lost?
Between 1979 and 2023, the two ice sheets lost about 11,309 billion metric tons of ice, raising global sea level by 31.4 millimetres, according to the 2026 IMBIE assessment. Greenland lost the larger share.
Is surface melting or glacier flow the bigger cause?
Glacier flow. About 84 percent of the combined ice sheet loss came from glaciers speeding up and discharging ice into the ocean, and only about 16 percent from surface melting, in the same assessment.
What is a melt day?
A melt day is a measure of melting across a glacier’s surface. It can be one full day when the whole glacier melts, or several days when parts of it melt, adding up to the same total area. More melt days mean a longer melt season and faster net ice loss.
Does glacier shape really change the melt rate?
Yes. As glaciers shrink, they sit at lower, warmer altitudes, which adds extra loss on top of warming itself. In Spitsbergen, researchers measured 1 to 2 percent extra annual loss for one glacier from this effect alone.
Will ice cliffs collapse and flood the world suddenly?
The 2026 global ice-cliff survey found that rapid retreats seen so far were short-lived, with glaciers restabilizing afterwards. That is reassuring, but scientists warn it may not hold as warming continues, so monitoring continues.
Why should I care about a few centimetres of sea level rise?
Because every centimetre puts another 2 to 3 million people in the path of at least one flood a year. Small global numbers mean very large human numbers, especially for low-lying coastal cities.
Final Thoughts
I started this article with two photographs of one Alaskan valley, and I will end with what they taught me. The ice is not vanishing in secret. It is being watched, week by week, by radar that sees through storms, by lasers that measure height, and by scientists who walk the ice to check the machines. The numbers they bring back are sobering: three extra weeks of melt per degree, trillions of tons lost, millions more people facing floods. But the watching itself gives me hope, because a problem we measure precisely is a problem we can plan for. Congratulations for reading this far: you now understand glacier science better than most headlines assume. Tell me in the comments: has your town ever flooded, and do you think about sea level when you hear glacier news? I read every answer, and your local story makes this global science feel human.
React to this story